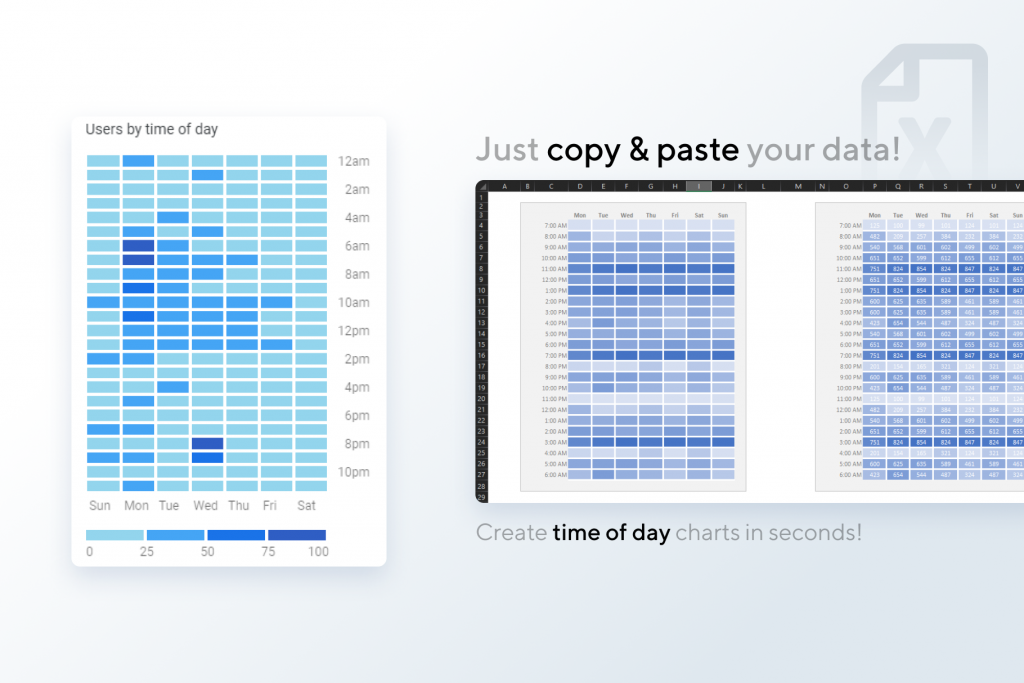
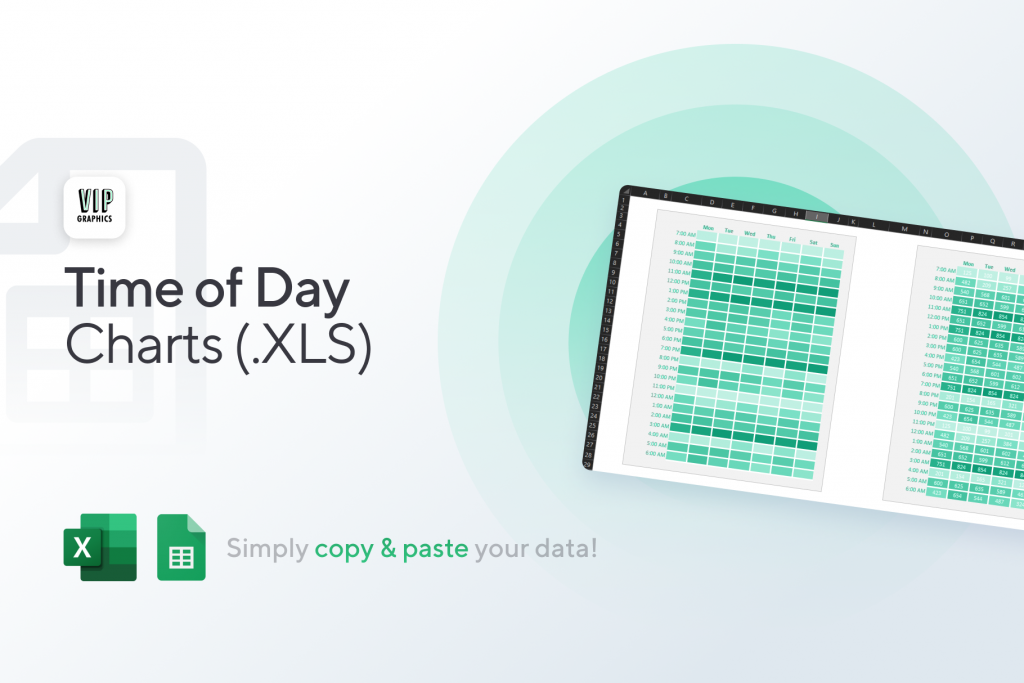
Do you wish you could create a “Google Analytics”-style Time of Day chart in Excel or Google Sheets? Imagine if you could easily analyze your busiest time(s) of day with simple density charts based on sales or signup data.
With the Time of Day Chart template, you can simply copy & paste your data from raw CSV exports or pivot tables directly into our spreadsheet to immediately create a visual Time of Day chart and visualize your busiest hours every day.
This simple and effective template will help you to better understand your data and optimize your marketing efforts — easily visualize your busiest times in Excel & get actionable insights! Try the clean & customizable, 100%-editable template for busiest Time of Day charts.
Features
- 2 Styles (visible & hidden text)
- 24 hours, 7 days a week
- Fully editable in Excel or Google Sheets
- 1-click font & color themes


